

Introduction – Why Business Analysis Matters
Across Nigeria’s urban and rural markets, small and medium enterprises (SMEs) form the backbone of the economy. According to the National Bureau of Statistics, SMEs contribute nearly 50% of GDP and employ over 80% of the labor force. Yet despite their importance, many operate with limited financial visibility. Shop owners and distributors may track sales receipts but often fail to calculate their actual margins, identify seasonal peaks, or anticipate rising costs.
This lack of structured analysis carries risks. A detergent business, for instance, may believe it is profitable because sales volumes appear healthy. However, without carefully separating revenue from costs, a business can be “moving money” rather than generating true profit.
Business analysis provides the discipline required to avoid such blind spots. It involves converting raw numbers into structured insights:
-
Profitability clarity – distinguishing turnover from actual gain.
-
Trend recognition – identifying which months, products, or markets outperform.
-
Cost control – spotting inefficiencies that erode margins.
-
Opportunity mapping – assessing which markets or distribution channels can be expanded.
While large corporations employ data analysts and ERP systems, SMEs can achieve similar clarity using a simple but powerful tool: Microsoft Excel.
In this article Business Analysis with Excel in Nigeria, we construct a hypothetical case study of FreshWave Detergents, a fictional Nigerian SME in the household cleaning market. By simulating sales and profit data, we show how Excel can transform assumptions into actionable insights, revealing patterns that guide decision-making.
Defining the Hypothetical Business Scenario
FreshWave Detergents is modeled as a consumer goods SME based in Lagos, competing in a highly fragmented market dominated by global brands (Unilever, Procter & Gamble) and regional players (PZ Cussons). Despite the dominance of these giants, Nigeria’s large population (over 220 million) ensures space for emerging local brands, particularly those offering affordability and localized distribution.
To simplify the simulation, we assume FreshWave begins with two products: powder detergent and liquid detergent. Prices and costs are designed to reflect current consumer realities:
-
Unit Selling Price: ₦1,200 per pack
-
Unit Cost (production + distribution): ₦900 per pack
-
Sales Volumes: Variable, reflecting seasonal demand and marketing fluctuations
Base Sales Data (January–April)
| Month | Units Sold | Unit Price (₦) | Cost per Unit (₦) |
|---|---|---|---|
| Jan | 500 | 1,200 | 900 |
| Feb | 450 | 1,200 | 900 |
| Mar | 600 | 1,200 | 900 |
| Apr | 550 | 1,200 | 900 |
This foundational dataset mirrors the type of assumptions entrepreneurs make when preparing feasibility studies or seeking bank loans. Even without audited statements, “what-if” modeling allows SMEs to stress-test business ideas.
Constructing the Excel Profit Model
To transform these raw numbers into actionable insights, FreshWave structures its data into an Excel sheet with the following columns:
-
Month
-
Units Sold
-
Unit Price
-
Cost per Unit
-
Total Revenue (= Units × Price)
-
Total Cost (= Units × Cost)
-
Profit (= Revenue – Cost)
-
Profit Margin % (= Profit ÷ Revenue)
Modeled Output Table
| Month | Units Sold | Revenue (₦) | Total Cost (₦) | Profit (₦) | Margin % |
|---|---|---|---|---|---|
| Jan | 500 | 600,000 | 450,000 | 150,000 | 25% |
| Feb | 450 | 540,000 | 405,000 | 135,000 | 25% |
| Mar | 600 | 720,000 | 540,000 | 180,000 | 25% |
| Apr | 550 | 660,000 | 495,000 | 165,000 | 25% |
The consistent 25% profit margin underscores a simple reality: in FMCG businesses, volume is king. Unless pricing power changes, profitability depends on driving unit sales higher.
Visualizing Data with Excel Charts
Numbers are valuable, but visualization communicates faster. FreshWave deploys three standard Excel charts:
-
Line Chart (Units Sold): Reveals the February dip (450 units) and March spike (600 units).
![]()
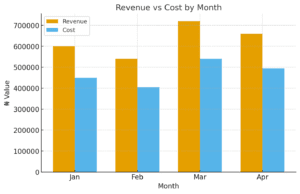
-
Bar Chart (Revenue vs. Cost): Displays the gap between sales and costs, illustrating steady profit spread.
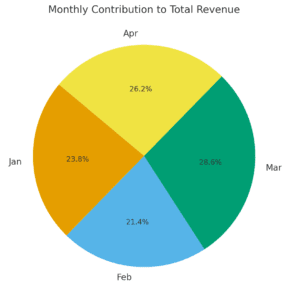
-
Pie Chart (Revenue Contribution): March emerges as the top-performing month, contributing 28.5% of total revenue.
For SMEs, charts offer a low-barrier method to translate spreadsheets into boardroom-ready presentations for investors or lenders.
Sales and Profit Performance Analysis
Key Financial Outcomes (Jan–Apr)
-
Highest Monthly Profit: ₦180,000 (March)
-
Lowest Monthly Profit: ₦135,000 (February)
-
Average Monthly Profit: ₦157,500
-
Cumulative Revenue: ₦2.52 million
-
Cumulative Profit: ₦630,000
Interpretation
-
Volume-Sensitive Business: Margins are stable, but overall profit is fragile without consistent sales growth.
-
February Dip: Could signal seasonality, poor marketing, or stronger competition.
-
March Recovery: Possibly driven by festive spending (Easter), promotions, or improved distribution.
RELATED: The Complete Guide to Business Analysis: Strategies, Tools, and Case Studies for Smarter Growth
In practice, Nigerian detergent businesses must monitor not just sales but also inflation and foreign exchange (FX) volatility, as imported raw materials like surfactants or packaging are tied to the dollar.
Advanced Scenario Testing
Excel’s “What-If” tools allow SMEs to test strategies before execution.
-
Scenario 1 – 10% Sales Increase (March): Profit rises to ₦198,000.
-
Scenario 2 – 5% Cost Reduction: Profit grows to ₦207,000.
Lesson: Minor adjustments—whether boosting sales volume or reducing unit costs—translate into substantial gains. This reflects the thin-margin reality of consumer goods: efficiency matters.
Industry Context: Nigeria’s Detergent Market
To ground the analysis, we must consider FreshWave’s competitive environment. Nigeria’s detergent market is valued at over $500 million annually, with high brand recognition for OMO (Unilever), Ariel (Procter & Gamble), and Morning Fresh (PZ Cussons).
Key Industry Realities:
-
Price Sensitivity: Nigerian consumers prioritize affordability; ₦50 price differences influence brand loyalty.
-
Informal Distribution: Open markets, kiosks, and street vendors drive volume sales more than modern retail.
-
Inflation Pressures: With inflation above 25% (2025), raw material costs and logistics (diesel, transportation) squeeze margins.
-
Local Substitutes: Some consumers shift to bar soap or locally mixed detergents during price spikes.
For SMEs like FreshWave, success depends on balancing affordable pricing, lean operations, and distribution efficiency.
SWOT Analysis
Strengths
-
Predictable 25% margin structure
-
Entry point into a massive consumer market
-
Flexibility as a small, locally positioned brand
Weaknesses
-
Limited brand recognition compared to multinationals
-
Reliance on urban markets only
-
Exposure to currency swings (if raw materials are imported)
Opportunities
-
Expansion into rural Nigeria, where detergent penetration is still growing
-
Online sales (Jumia, Konga) and social commerce for direct-to-consumer delivery
-
Niche positioning with eco-friendly or hypoallergenic detergents
Threats
-
Rising raw material costs (linked to FX and inflation)
-
Aggressive promotions by established FMCG giants
-
Supply chain disruptions (ports, logistics strikes, insecurity)
Strategic Recommendations
-
Replicate March’s success: Study demand triggers—festive sales, promotions, or improved distribution. Standardize these drivers into future campaigns.
-
Address February weakness: Test promotional pricing or invest in awareness campaigns to smooth seasonal volatility.
-
Cost discipline: Explore local sourcing of raw materials to reduce FX exposure. Bulk procurement could also lower per-unit costs.
-
Channel diversification: Expand into open-air markets and e-commerce platforms simultaneously, ensuring resilience against distribution bottlenecks.
-
Dashboards for management: Develop monthly Excel dashboards to track key KPIs—units sold, margin %, cost per unit, and revenue contribution by channel.
Broader Lessons for Nigerian SMEs
-
Financial Literacy Gap: Many SMEs lack structured analysis. Excel can bridge that gap affordably.
-
Margins Require Vigilance: In inflationary economies, stable profit percentages can erode quickly if costs rise unchecked.
-
Scenario Planning Builds Resilience: Testing different sales or cost assumptions prepares businesses for shocks—be it fuel subsidy removal, FX devaluation, or logistics strikes.
-
Data Builds Investor Confidence: Banks and microfinance institutions are more willing to lend when entrepreneurs demonstrate financial discipline with proper records.
RELATED:
How Excel Business Modeling Helps Nigerian SMEs Survive Inflation and FX Risks
How Startups Are Winning with Smart Capital Strategies
Nigeria’s Economy Is Recovering — So Why Are People Still Struggling?
Conclusion
FreshWave’s simulation proves a broader point: Excel is not just a spreadsheet; it is a decision-making engine. By modeling revenue, cost, and profit, SMEs can expose blind spots, identify growth levers, and prepare for volatility.
In Nigeria’s competitive detergent market, survival depends on more than just selling units. It requires structured analysis, discipline in cost control, and adaptability to local market dynamics.
For SMEs across Africa, the lesson is clear: whether you sell detergents, bread, or fashion items, Excel can serve as your most powerful—and affordable—business microscope.
References
-
National Bureau of Statistics (NBS) – SME Contribution to GDP
-
Microsoft Excel Support – support.microsoft.com/excel
-
Investopedia – Profit Margin and Cost Analysis – investopedia.com
-
Harvard Business Review – Business Analytics for Decision Making – hbr.org
-
KPMG Nigeria – FMCG Industry Report
-
Euromonitor – Detergents Market in Sub-Saharan Africa
Thanks for sharing. I read many of your blog posts, cool, your blog is very good.